Debugging in Safari's Web Inspector, when using a module loader like SystemJS
JavascriptSafariEcmascript 6SystemjsWeb InspectorJavascript Problem Overview
I'm creating an Ionic app using es6 modules, TypeScript and SystemJS as a module loader. This is my setup:
tsconfig.json:
{
  "compilerOptions": {
    ...
    "target": "es5",
    "module": "system",
    ...
  }
}
index.html:
<script src="lib/system.js"></script>
<script src="systemjs.config.js"></script>
<script>System.import('js/app.js')</script>
example script (TypeScript):
import {IConfig} from "./app-config";

export class ConfigLoader {
    ...
}
Everything runs great in Chrome. However, when debugging using Safari's Web Inspector, I cannot place any breakpoints in the scripts because Web Inspector only shows scripts that are loaded directly from the HTML (through script tags), and not scripts loaded by XHR (in my case, by SystemJS). This means I cannot debug my own scripts, which is of course unacceptable.
I tried to work around this by using SystemJS like before, but also placing the script tags in the html, like so:
<script src="lib/system.js"></script>
<script src="systemjs.config.js"></script>
<script src="js/app-config.js"></script>
 ... other app scripts
<script>System.import('js/app.js')</script>
However, this doesn't work, as SystemJS does not seem happy about this:
> Invalid System.register call. Anonymous System.register calls can only > be made by modules loaded by SystemJS.import and not via script tags.
How do I use SystemJS and at the same time have the ability to debug in Safari? I'm looking for a solution a little more sophisticated than 'put a debugger statement in each script'...
Javascript Solutions
Solution 1 - Javascript
Well, maybe you can use some IDE like WebStorm with a strong Debugger for Web and Node.
Examples:
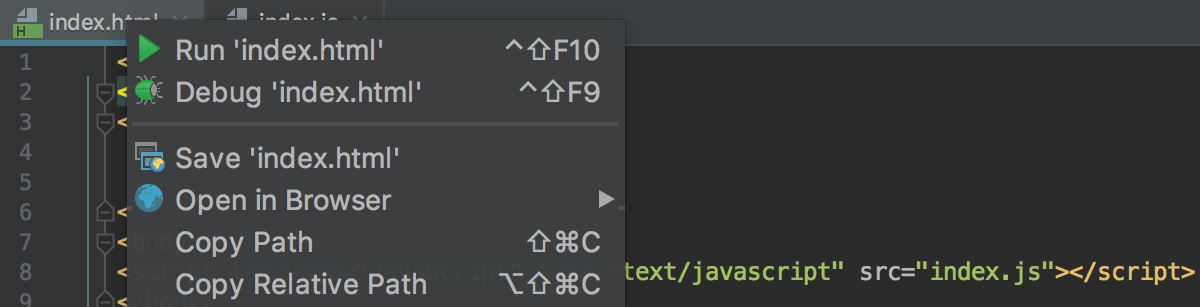
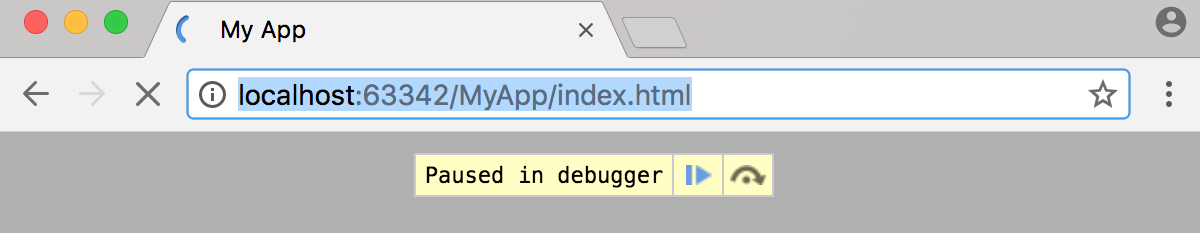
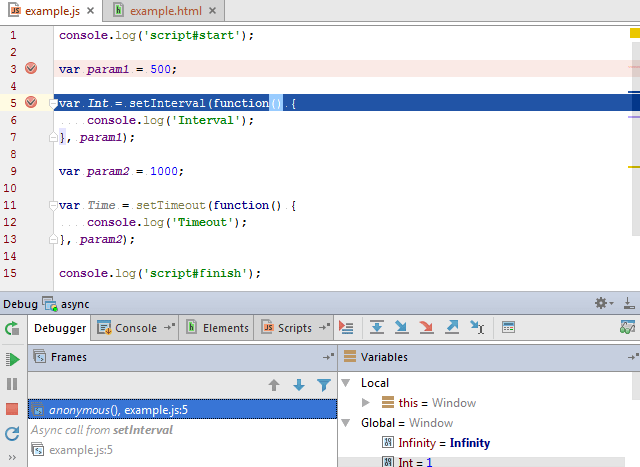
You can see more about WebStorm debugger here.
Some alternatives for WebStorm:
- Atom (Free)
- Intellij IDEA (community: Free)
- Visual Studio Code (Free)
- ...
P.S: I develop Ionic and React apps with WebStorm :D
Solution 2 - Javascript
Have you looked into using a remote debugger, such as https://github.com/google/ios-webkit-debug-proxy.
Also there is ghostlab, here is a nice article on getting started https://css-tricks.com/using-chrome-devtools-to-debug-javascript-in-any-browser-with-ghostlab-2/